"The strongest bull markets I've ever been in are built on walls of worry."
When the United States attacked Iran in late February 2026, the S&P 500 went into a free fall. As oil prices surged above $115 a barrel and a recession looked inevitable, the S&P 500 dropped roughly 9.1% at its worst, from its pre-war level of 6,878. And then, when no one was expecting, the market recovered, all of it, in about 11 days.
As of writing, the Iran conflict is still far from resolved, and oil is trading nearly 70% up YTD; yet the S&P 500 sits at 7,473 - up approximately 9% year to date. This is a historical pattern: the market gets spooked by a geopolitical crisis, but it bounces back soon.
The wall of worry, built over a century
Pull up any long-run chart of the S&P 500, and you will notice something that may not be intuitive when you watch the news headlines. According to data from Yardeni Research and LSEG Datastream, the index has compounded at a CAGR of 6.72% since January 1921. But that one number also contains Pearl Harbor, the Cold War, the Cuban Missile Crisis, the 1973 oil shock, 9/11, the Global Financial Crisis, and a once-in-a-century pandemic that shut the world economy for months.
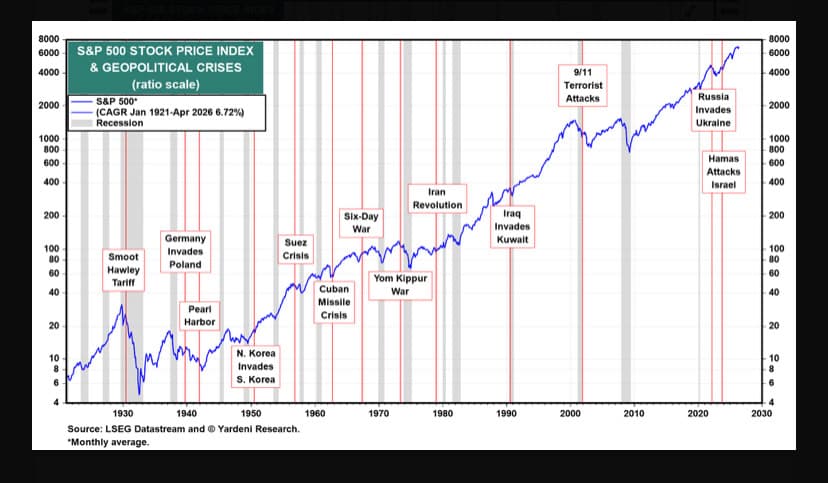
The S&P 500 has survived every major crisis since 1921 and continued higher. Source: Yardeni Research, LSEG Datastream.
The short, medium, and long story
The long run is one thing, but what about the short and medium term, when investor sentiment is at its lowest, and they are deciding whether to stay invested or exit?
T. Rowe Price tracked exactly this - S&P 500 performance in the days, months, and years following every major geopolitical crisis since 2000.
When the Iraq War began in March 2003, the S&P 500 was up 28.96% over the next 12 months. Brexit sent markets down 3.59% on the day of the vote. Twelve months later, the index had gained 17.81%. When Hamas attacked Israel in October 2023, the S&P 500 actually rose 0.60% on the day. The 12-month return that followed: 35.42%.
Even the messier cases tell the same story eventually. Russia invaded Ukraine in February 2022. The 12-month return was negative 5.86%, but that was almost entirely the Federal Reserve's doing - the most aggressive rate-hiking cycle in four decades had markets on the back foot all year. Three years after the invasion, the S&P 500 was up 13.48%.
While arguing that geopolitics can break the market in the long run, many take the example of 9/11. The index fell 4.90% when trading resumed, and the 12-month return was negative 16.80%. But the U.S. had been in a recession since March 2001, and the market didn't yet recover from the dot-com bust. Within three years, the market had recovered and posted a 2.66% gain.
Every single geopolitical event in the past decades shows this consistent pattern: sharp correction driven by fear and eventual recovery without having a permanent dent.
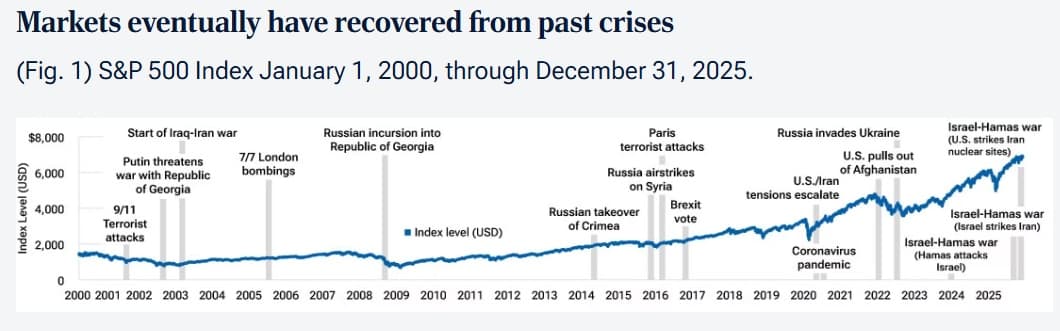
S&P 500 performance during and after major crises since 2000. Source: T. Rowe Price, S&P.
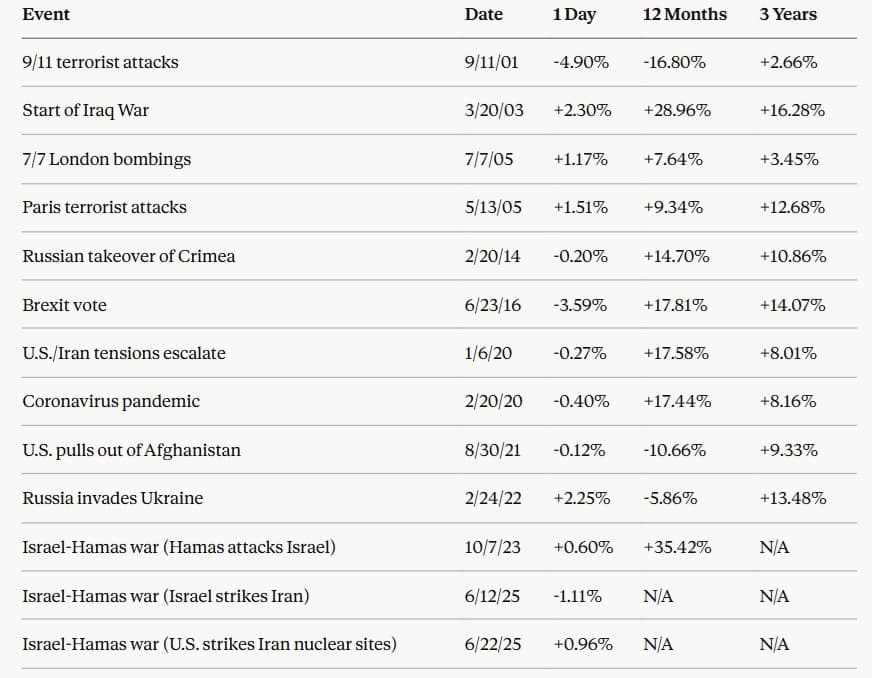
- Data source: T. Rowe Price, S&P.
Why does the market keep doing this?
It all comes down to three things, which may not be obvious when superpowers are busy fighting wars:
Markets price in fear very fast. By the time most people have processed the news and logged into their brokerage accounts, professional investors and algorithms have already sold. This is reflected in the sharp one-day drop in the table above. This also shows how the market does its job: absorbing shock and repricing quickly.
Most crises do not break the economy. Of course, they break sentiments, which is a very different thing. Despite wars, attacks, and political shocks creating economy-wide uncertainty, they rarely change the fundamental ability of businesses to generate profits. The 1973 Arab oil embargo, however, was the exception - it was a structural hit to the entire cost base of the economy, and the S&P 500 fell nearly 48% over 21 months as a result. Most crises do not come close to that kind of damage.
And the cost of waiting is almost always worse than the cost of staying in. The Motley Fool looked at every U.S. recession since 1980. In every single case, the S&P 500 recovered and went on to new highs. A $100 investment in an S&P 500 index fund on December 31, 1979, held through six recessions, would be worth more than $4,000 today through pure patience.
A hundred years of S&P 500 data backs Cathie Wood's observation that the strongest bull markets are built on walls of worry. In most cases, geopolitical crises look likely to damage economies permanently. But that has never been the case.