On November 13, 1998, theglobe.com launched its Initial Public Offering (IPO) at $9 per share. Just after the opening bell, the stock skyrocketed to $87 before touching $97 by lunch. By the closing bell, the stock had settled for sixty-three fifty, a gain of 606% in a single session.
It was, for the moment, the biggest first-day pop any American IPO had ever produced. The company behind it was a message-board site run by two Cornell graduates in their twenties. In the nine months before the IPO, it generated $2.7 million in revenue and incurred an $11.5 million loss. Three years later, the stock was trading at 10 cents per share before being delisted from Nasdaq entirely.
It's folklore in the investing world how investing $1,000 in Amazon's 1997 IPO would be worth nearly $3 million today. But that story leaves out almost everything else - for every Amazon, there were dozens of theglobe.coms, companies that soared on day one and then disappeared as if they never existed.
What if an investor had simply bought every company that went public in the United States since 1980, all nine thousand plus of them, and just held on? Would that simple, no-filtering approach have beaten a basic index fund?
Jay Ritter, a finance professor at the University of Florida, has tracked this data since the early nineties. He's spent three decades answering exactly that question. Let's explore what he found.
Why IPO investing looks so attractive
On August 9, 1995, Netscape, a sixteen-month-old company that never earned any profit, went public. The night before the offering, the underwriters got nervous that they'd undersold the deal and doubled the price from $14 to $28.
As trading started the next morning, almost two hours late because nobody could match the orders, the stock opened at $71. By the closing bell, cofounder Jim Clark's $4 million stake was worth $566 million.
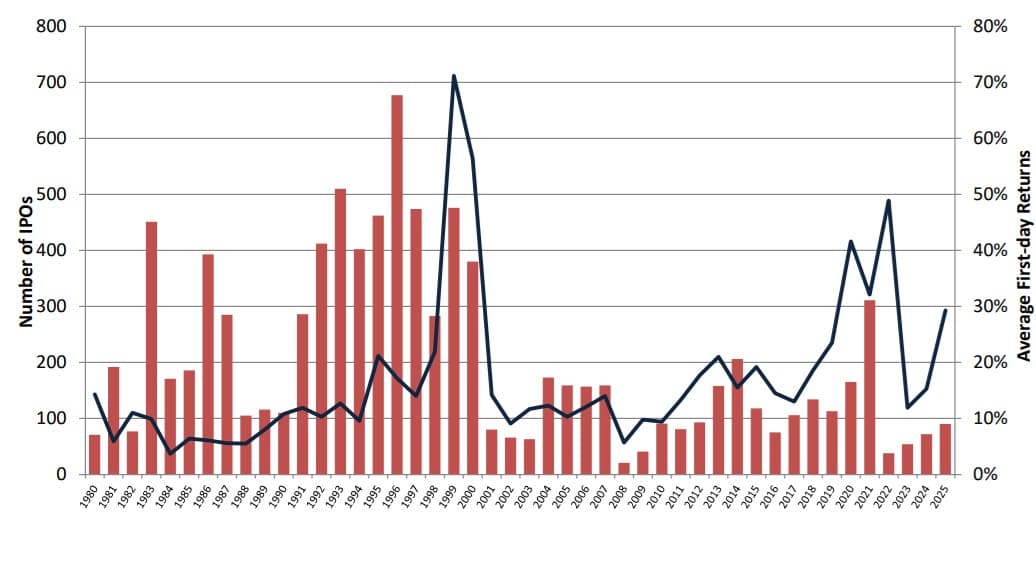
IPO investing got its popularity for stories like these, which make making money in stocks sound easy. Across 9,343 IPOs in the United States from 1980 through 2025, tracked by University of Florida finance professor Jay Ritter, the average first-day return is 19.0%.
But that's not the return an average retail investor gets to keep.
The pop happens between the offer price and the opening trade, and that gain goes to whoever held shares before the bell rang, mostly underwriters and their institutional clients, not the public buying once trading has already started. By the time ordinary investors place an order, they're buying at a price the market has already repriced upward.
That asymmetry shows up in the data, too.
IPOs with venture capital backing, the ones more likely to arrive with built-in institutional demand and informed early buyers, average a 27.0% first-day return. IPOs without VC backing average 13.5%, less than half as much.
The 19% average hides another important fact. IPOs barely popped at all through the 1980s, averaging 7.2%. That climbed to 14.8% through the rest of the nineties, then exploded to 64.6% during the 1999-2000 bubble, the same period in which theglobe.com's IPO happened. After the bubble burst, the average settled back to 19.1% from 2001 through 2025, almost exactly the long-run figure.
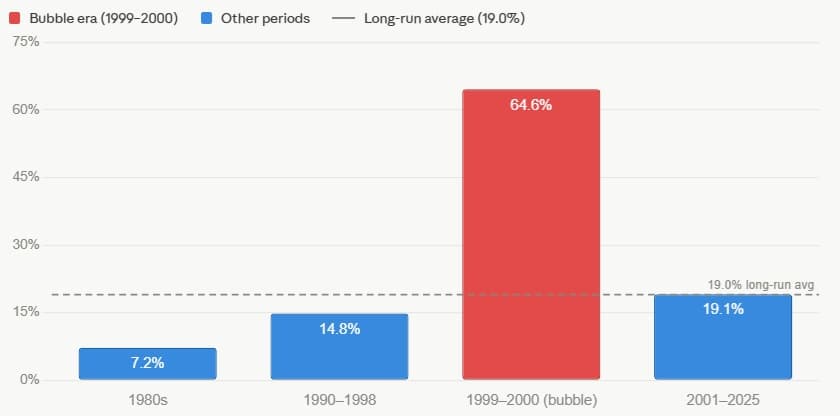
A key takeaway is that the hotter the market gets, the bigger the day-one pop, and the biggest pops on record cluster almost around the years investors now remember as manias.
The long and short story: What happens after 1, 3, and 5 years out
Across the same 9,253 IPOs Ritter has tracked from 1980 through 2024, the average return in the first year after listing is 5.6%, less than a third of the 19% rise that happens on day one alone.
But that average number also hides a wide spread by issuance year. The story holds up only when you buy into the right cohort: investors in the 1982 IPO class were up 101.8% a year later, and the 1984 and 1994 classes gained 20% and 27.8%.
But it's an entirely different picture when you buy the wrong one. Companies that went public in 2000, right as the bubble burst, lost 52.9% in their first year. The 2008 cohort, listing straight into the financial crisis, lost 34.4%, and the 2021 and 2022 classes, the last gasp of the post-pandemic boom, lost 49.1% and 27.7% respectively.
Let's look at the three-year numbers:
Across the full 1980-2024 sample, the average IPO returned 19.1% over its first three years, which sounds fine in isolation. But when we measure it against the market, the same group returned -20.5%. Measured against similar companies based on size and valuation, it's -8.9%.
According to Ritter, this -20.5% translates into an annualized underperformance of 5.5% a year, based on an average holding period of 2.8 years rather than a full three, since a lot of IPOs get delisted, acquired, or go under before reaching their third anniversary.
The five-year data tells a similar story to the three-year one. IPOs underperform companies of the same size by 3.6% a year over the five years after listing, and underperform companies matched on both size and valuation by 2.1% a year, and that's before counting the first-day pop at all.
Jeremy Siegel found something similar working independently: across 8,606 IPOs, he studied for Stocks for the Long Run, 79% underperformed a small-stock benchmark, and almost half underperformed by more than 10 percentage points a year.
Why do IPOs underperform?
There are several potential reasons. The first one is timing: most companies file for IPOs when investor appetite is strong, valuations are high, and the market is most likely to pay generously for a story about future growth. Bankers keep an eye on these market conditions, and this explains why IPO supply peaks at exactly the moment the market is most likely to be overextended.
Next is the fact that an IPO is priced to clear the market, which makes the IPO price a reflection of market enthusiasm rather than fair value. Investment banks spend weeks building institutional demand and deliberately leave something on the table so the stock opens higher than the offer price and the whole thing feels like a huge success.
By the time an ordinary investor places a buy order, most of the value has already been captured.
Then there's this entire ecosystem of insiders who know what public buyers don't. The venture capitalists, the founders, the early employees, the investment bankers who've spent months in the data room have a much higher level of familiarity with the business that a retail investor reading a prospectus over a weekend simply cannot replicate.
So, Should You Invest in IPOs?
They say , and the historical data regarding IPO investing says the same thing. IPO investing may suit you under certain conditions, which are narrower than most of the coverage around any given IPO would suggest.
Getting allotted at the offer price rather than buying once the stock opens for trading puts you in a structurally different trade. That 19% average first-day return flows to whoever is holding shares before the opening bell, mostly institutional investors and the preferred clients of underwriting banks.
The second condition is time. Ritter's data shows enormous variance by cohort, and the investors who've done well with IPOs historically are the ones who bought a broad enough basket and held long enough for the few genuine winners to do most of the work. That's a harder strategy because you need to sit through years of underperformance in the majority of names.
One important takeaway is that across more than nine thousand IPOs since 1980, the average company that went public underperformed the market by 5.5% a year over the following three years. That underperformance comes from the fact that IPOs are timed by sellers into favorable markets, priced to generate institutional enthusiasm rather than to find fair value, and bought by a public that has a fraction of the information held by the people on the other side of the trade.